SANER falls into a space of healthcare that most Health IT developers aren't familiar with, or at least so far as they know.
This post is going to show how measures of situation awareness fit into existing math/science, quality measurement and software monitoring techniques and reporting already well understood by software developers and system architects.
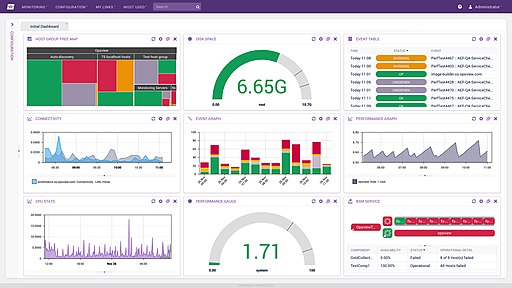
If you live in the enterprise or cloud-based software development space (as I have for decades), you've built and/or used tools for application monitoring. Your tools have reported or graphed one or more of the following:
- The status of one or more services (up/down).
- The stability of one more more services.
- Utilization as compared to available capacity (file handles, network sockets, database connections).
- Events over time within time period and cumulatively (total errors, restarts, other events of interest, hits on a web page).
- Queue lengths (outstanding http requests, services waiting on a database connection, database locks).
- Average service times (also 50%, 75% and 90% times).
This is all about situation awareness, where the "situation" is your application. There's ton's of science (and math) around use, aggregation, et cetera, of these sorts of measurements. People write Theses to get masters degrees and PhD's to advance the science (or math) here, or just to implementation some of it.
Let's look at this again from a different perspective:
- The status of one or more services (up/down).
- Is your ED open?
- Do you have power?
- Do you have water?
- Do you have PPE?
- Do you have staff?
- The stability of one more more services:
- Are you going to run out of a critical resource sometime soon?
- Do you have enough staff?
- Utilization as compared to available capacity:
- How many beds are filled and free in your hospital?
- Your ICU?
- How many ventilators are in use or free?
- Events within time period and cumulatively over time:
- How many tests did you do today and over all time?
- How many were positive?
- How many admissions did you have?
- For COVID-19?
- Queue lengths:
- How many people with suspected or confirmed COVID-19 are waiting for a bed?
- How many COVID-19 tests are awaiting results?
- Average service times.
- How long is it taking to provide lab test results for patients?
- What is the average length of stay for a COVID-19 patient?
I'm not making the questions that are being asked up, they come from real world measures that are being reported today by many organizations around the world. All of the above are at some level essential elements of information for management of the public health response to COVID-19 or other emergency.
Hopefully you can see how the measures being requested are basically the same things you've been using all along to monitor your applications, except instead, they are being used to monitor our healthcare systems.
Keith

Thanks
ReplyDelete