Monday, August 24, 2020

Examining Model / Workflow Variations in the use of FHIR Resources for SANER


In working through how to automate measure computation for SANER, I've encountered some interesting (or not so interesting) variations in organizational representation and/or workflow which impacts how different information is captured.

These variations may depend on EHR implementation of the FHIR Standard, or US Core or other national guide, or may simply depend on which components of an EHR a provider users or doesn't use to track some forms of activity.

Some examples:

Why did this encounter occur?  This question can be answered in various ways:

  1. The encounter has an admission diagnosis of X
  2. The encounter has a reason code of X
  3. The encounter references a Condition coded with X
  4. The encounter references an Observation coded with X having value Y
  5. There is a condition recorded during the encounter with a code of X
  6. There is an observation recorded during the encounter with a code of X having a value of Y
The patient has deceased:
  1. The patient is discharged with a disposition indicating deceased.
  2. The patient is identified as having died.
  3. The patient has a deceased date.
  4. The patient is discharged to a location that indicates the patient is deceased.
Medication (in hospital) was started on day X, and finished on day Y
  1. Request date has X, last administration referencing order has Y.
  2. Timing in order represents X and Y, order is updated after a discontinuation order (e.g., for cases like "until the patient is better").
  3. Simply look at medication administration records.
  4. Look at medication statement records.
  5. Other combinations of 1-4 above.
Until such representations become standardized, systems which are trying to automate around some of these questions will have to look down a number of different pathways to address these differences.


Thursday, August 20, 2020

Essential Elements of Information

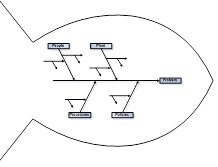
Fishbone Diagram
I spend a lot time learning new stuff, and I like to share.  Most recently, I've spent a lot of time learning about Essential Elements of Information (EEIs), or as I like to call them, measures of situation awareness.

EEIs, or measures of situation awareness work the same way as quality control measures work on a process.  You follow the process, and measure those items that are critical to quality.  Finding the things that are critical to quality means looking at the various possible failure modes, and root causes behind those failures.

Let's follow the pathway, shall we, for COVID-19:

We look at the disease process in a single patient, and I'll start with a complaint, rather than earlier.  Patient complains of X (e.g., fever, dry cough, inability to smell/taste, et cetera).  From there, they are seen by a provider who collects subjective data (symptoms), objective data (findings), performs diagnostics, and makes recommendations for treatment (e.g., quarantining, rest, medication) or higher levels of care (admission to a hospital or ICU), more treatment (e.g., intubation), changing treatment (e.g., extubation), changing levels of care (discharge), and follow up (rehabilitation), monitoring long term changes in health (e.g., after effects, chronic conditions).

That's not the only pathway, there are others of interest.  There may be preventative medications or treatments (e.g., immunization).

In each of these cases, there are potential reasons why the course of action cannot be execute (a failure).  Root cause analysis can trace this back (ICU beds not available, medication not available, diagnostic testing not available or delayed).  

As new quality issues arise, each one gets its own root-cause-analysis, and new measures can be developed to identify onset, risk of those causes.

We (software engineers*, in fact engineers in general) do this all the time in critical software systems, and often, it's just a thought experiment, we don't need to see the event to predict that it might occur, and prepare for its eventuality.

Almost all of what has happened with COVID-19 with respect to situation awareness has either been readily predicable, OR has had a very early signal (a quality issue) that needed further analysis.  If one Canary dies in the coal mine, you don't wait for the second to start figuring out what to do.  The same should be true as we see quality issues arise during pandemic.

Let's talk about some of the reasons behind some of the Use Cases SANER proposed for measures, and why:

SANER started in the last week of March, by April 4 we had already understood the need for these measures:

  1. PPE ... before there was a measure for PPE, there was a CDC spreadsheet to determine utilization of PPE, there were media report about mask availability, people couldn't buy disinfectants.
  2. What happens when providers get sick? Or provider demand exceeds local supply?
  3. Hearing about limited testing supplies in NYC (sample kits, not tests).
  4. Stratification by age and gender: Many state dashboards were already showing this.

    and by April 10, 
  5. Ethnic populations are getting harder hit we hear from a provider in Boston.  Social determinants need to be tracked.

    in June we added one more that we knew about but hadn't written down yet
  6. Non-acute settings (e.g., Rehabilitation and long term care) need attention.  We actually knew this back in late February.

    In the Future we can already tell that:
  7. There will be more diagnostic tests to account for.
  8. As we learn about treatments (e.g., Medications), we'll need measures on use and supplies
  9. As immunizations become available, again we'll need measures on use and supplies, but also measures on ambulatory provider capacity to deliver same.
Over time we saw various responses to shortages that meant different things also needed to be tracked:
  1. Do you have a process to reuse usually disposable materials (e.g., masks)?
  2. What is the rate of growth in cases/consumption/other quantifiable thing presently being experienced by your institution. Different stages of the pandemic have different growth characteristics, e.g., exponential, linear, steady state at different times and regions.

* And if you aren't doing this in your software on a routine basis, you are programming, not engineering.


Wednesday, August 19, 2020

Similarities between SANER and Application Monitoring

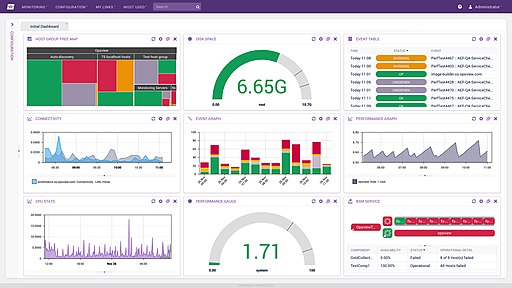
Opsview Monitor 6.0 Dashboard

SANER falls into a space of healthcare that most Health IT developers aren't familiar with, or at least so far as they know.  

This post is going to show how measures of situation awareness fit into existing math/science, quality measurement and software monitoring techniques and reporting already well understood by software developers and system architects. 

If you live in the enterprise or cloud-based software development space (as I have for decades), you've built and/or used tools for application monitoring.  Your tools have reported or graphed one or more of the following:

  1. The status of one or more services (up/down).
  2. The stability of one more more services.
  3. Utilization as compared to available capacity (file handles, network sockets, database connections).
  4. Events over time within time period and cumulatively (total errors, restarts, other events of interest, hits on a web page).
  5. Queue lengths (outstanding http requests, services waiting on a database connection, database locks).
  6. Average service times (also 50%, 75% and 90% times).
This is all about situation awareness, where the "situation" is your application.  There's ton's of science (and math) around use, aggregation, et cetera, of these sorts of measurements.  People write Theses to get masters degrees and PhD's to advance the science (or math) here, or just to implementation some of it.

Let's look at this again from a different perspective:

  1. The status of one or more services (up/down).
    1. Is your ED open?
    2. Do you have power?
    3. Do you have water?
    4. Do you have PPE?
    5. Do you have staff?
  2. The stability of one more more services:
    1. Are you going to run out of a critical resource sometime soon?
    2. Do you have enough staff?
  3. Utilization as compared to available capacity:
    1. How many beds are filled and free in your hospital?
    2. Your ICU?
    3. How many ventilators are in use or free?
  4. Events within time period and cumulatively over time:
    1. How many tests did you do today and over all time?
    2. How many were positive?
    3. How many admissions did you have?
    4. For COVID-19?
  5. Queue lengths:
    1. How many people with suspected or confirmed COVID-19 are waiting for a bed?
    2. How many COVID-19 tests are awaiting results?
  6. Average service times.
    1. How long is it taking to provide lab test results for patients?
    2. What is the average length of stay for a COVID-19 patient?
I'm not making the questions that are being asked up, they come from real world measures that are being reported today by many organizations around the world.  All of the above are at some level essential elements of information for management of the public health response to COVID-19 or other emergency.

Hopefully you can see how the measures being requested are basically the same things you've been using all along to monitor your applications, except instead, they are being used to monitor our healthcare systems.

   Keith


Tuesday, August 18, 2020

Differences between SANER and Quality Reporting Measures


As I work through SANER IG Development, more of the content is being focused on explaining measures of situation awareness and how they differ from measures for quality reporting.  While quality reporting and situation awareness measures share some of the same structures, they have different rules of engagement.

  1. Quality Reporting measures are expected to remain stable, Situation Awareness measures need to adapt to a changing environment and needs.

  2. Quality Reporting measures have a longer time frame to implementation (e.g., months), situation awareness measures are much shorter (weeks or even days).

  3. Quality Reporting measures have an identifiable financial return on investment based on payer and federal quality management and improvement programs (e.g., MIPS, MACRA, ACOs), Situation Awareness measures: Not so much.

  4. Hospitals are directly incented for quality measurement implementation with enough $ for a positive bottom line impact. While there are some reimbursement programs available (e.g., to states for emergency preparedness), those $ generally flow to states and through them to facilities, and generally only offset some of the costs of implementation.

  5. Situation Awareness measurement programs are driven by government mandates, Quality Reporting measures are incented by government payments.  It's a very thin gray line, because for most, the "incentives" are effectively mandatory for many implementers, but the fact that there's a payment involved means that the drivers for implementation inside an organization do exist for quality measurement.

  6. Quality measures come out of the healthcare space, Situation Awareness measures come from emergency preparedness and response space.  The intersection between these skill sets results in a smaller group of SMEs familiar with both sides (and I'm not fully there yet).


Wednesday, August 12, 2020

Picking COVID19 Value Sets for SANER

It's always fun when it comes time to choose standards because there are so many to choose from.  Here's a list off COVID-19 value sets from VSAC:
 

Fifty three different value sets, with overlapping codes and purposes. Which ones would you choose from?  How would you decide?  The SANER project needs to make some decisions to illustrate how to create a measure.

I have the same problem in software development when selecting 3rd party components.  Here's the criteria I've used for the past 20 years:
  1. How well does the component meet your need?
  2. What's the quality of the component?
  3. How well is the component maintained?
  4. How likely is it that they will continue to maintain it?
  5. How transparent are the maintainers development processes to you?
  6. How well used is the component by the rest of the industry?
  7. How good are the licensing terms?
These same criteria can be applied to value set selection.

For the VSAC Value Sets, there's basically 6 maintainers (in alphabetical order):
Let's do the evaluation:
  1. How well does the component meet our need?  
    About equally well.

  2. What's the quality of the component?
    Mostly the same.

  3. How well is the component maintained?
    The first two maintainers are private firms contributing value sets to VSAC for public use.  They very likely have a good maintenance process.

    The last two are government contractors or agencies who aren't NORMALLY in the Value Set maintenance business, and will likely turn these over to others for longer term maintenance.  Thee MITRE work is being done in collaboration with the COVID-19 Healthcare Coalition and has a high quality process. 

    The ONC work relies on early work by others, and so, while authoritative, is probably not going to be something that we want to use (not a ding on ONC, just the reality, they did what needed to be done to get the ball rolling, then stepped aside once others took it on).

    The middle two are organizations focused on the development of Value Sets, and CSTE is very focused on Epidemiology. They have high quality maintenance processes.

  4. How likely is it that they will continue to maintain it?
    For the proprietary solutions, I expect eventually to see them make way for an official maintainer of a value set for the same purpose.  The same is true for ONC and MITRE.  The COVID-19 Healthcare Coalition is formed for a very specific purpose, and hopefully will be short-lived (e.g., two years) as organizations go.  I expect that Logica and CSTE will have an ongoing and long-term commitment to their works.

  5. How transparent are the maintainers development processes to you?
    Mostly transparent across the board, but ... I don't have an easy way to engage in the processes by the proprietary vendors.  Logica has a membership model and function that doesn't add value for my needs, though others find it useful.  MITRE's process is very transparent, and ONC's not so much.

  6. How well used is the component?
    I cannot really answer this question today, but I can make some predictions for the future:
    CDC is very likely to rely on CSTE as they have done in the past.  The Logica work is going to see uptake by Logica members.  The MITRE work has seen uptake by members of the coalition it is working with.  ONC's work was early, and incorporated into other works, so also used, but more like merged with as components go.

  7. How good are the licensing terms:
    For users of a value set, all of these are generally freely available for use.  For IG publishers who want to "make a copy of them", the terms are (or in the future could be) somewhat limiting from the proprietary vendors and Logica.  I'd love to simply be able to reference them from VSAC, but frankly the FHIR publication interface is miserable for developers, and the access to VSAC publication pages also has other challenges of it's own.  I've inquired about ways to address this, but that's likely going to have to wait on some real funding to NLM.
In short, my priority list goes like this:
  1. If available from CSTE, use it.
  2. If available from the COVID-19 Healthcare Coalition (MITRE), use it.
  3. Don't bother with ONC, others have them covered better.
  4. Look too Logica to fill gaps.
  5. Skip the proprietary value sets.
Your mileage may vary.