 |
| Logistic Growth Curve (courtesy of Wikipedia) |
Recently, HHS released data on Meaningful Use attestations (through November of last year) on Data.gov. Brian Ahier posted a couple of extractions from this data earlier today. The data includes the following elements:
| Variable Name | Definition |
| Vendor Name | Name of EHR vendor |
| EHR Product Name | Name of EHR product |
| EHR Product Version | Version of EHR product |
| Product Classification | Whether product meets all Meaningful Use requirements (Complete) or meets only part of the Meaningful Use requirements (Modular) |
| Product Setting | Practice setting for which product is designed for (Ambulatory or Inpatient) |
| Attestation month | Month that the provider successfully attested to MU |
| Business State/Territory | Business location of provider who successfully attested to MU (state/territory) |
| Provider Type | Whether attestor was an eligible professional (EP) or eligible hospital (Hospital) |
| Specialty | Specialty or provider type |
| Program Year | Year of EHR Incentive Program |
| Payment Year | Payment year of EHR Incentive Program |
| Program Type | Whether the attestor registered under Medicare or Medicare/Medicaid |
| ID | Unique ID for each Attestor |
I put together a quick pivot chart report which showed the number of attestations by month for Meaningful Use, and looked at the growth trend. Here is how it looked:

| Month | Attestations |
| 4 | 506 |
| 5 | 812 |
| 6 | 1045 |
| 7 | 1461 |
| 8 | 2268 |
| 9 | 3774 |
| 10 | 5754 |
| 11 | 7341 |
What this chart clearly shows is that we are still in the exponential growth stage for attestations. I found some information on logistic curve fitting data. It required an estimation of the saturation point for the population, so I looked up the number of physician practices from Wikipedia and applied it to the model. Given the the disparity between EP attestations (21,461) and Hospital attestations (1,500), I figured that an estimate of 250,000 was sufficient.
What I wanted to find out by this was when MU would be "done" (i.e., CMS would be "saturated" with attestations), and my results were rather surprising. So I went back and checked it again with two other estimates (125K and 500K). Then I took the 95% confidence interval on my low and high estimates. I plotted it out so that you could see the range of possible answers here:
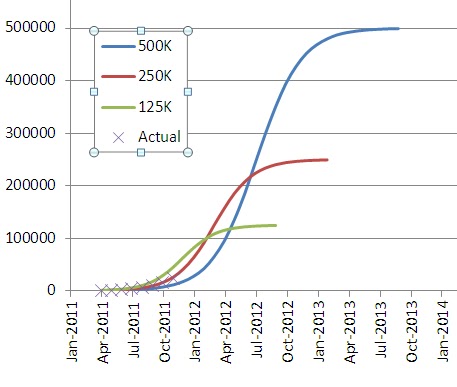
What this shows me is that by mid-year of 2012, we'll be halfway to saturation, and by the end of 2013, we'll have reached saturation. And if I'm too high on my estimate of providers, it will be by October of 2012, and if I'm to low it will be by October of 2013.
Now, my 95% bands were on the transformed linear equation, so I don't know how that impacts things with respect to confidence bands (I could figure it out, but I'm not that deeply interested). What this tells me is that Meaningful Use, rather than being "off schedule" appears to be ahead of schedule. I still don't know if I believe that.
One thing this model doesn't account for is how many providers attesting were already EHR users, and so were ready to attest, vs. those that have yet to adopt. I suspect that the market is just a bit more complex than a simple logistic curve can account for, but even if it is, there's still another whole year before "Meaningful Use" is over using the figures I went with. I'd stick with the "ahead of schedule" estimate at this point.
So, 2012 should see EHR adoption rates at several multiples of the current rate. We'll look at the numbers again when they've released new data to see how things are going.

0 comments:
Post a Comment