You generally hear about the accuracy of laboratory tests used in the US based on reporting sensitivity and specificity. These values help providers evaluate the likelihood of a true positive or true negative. These values aren't generally included in the laboratory result, but you can often get to them by knowing who did the test (the lab), and what test equipment they used, or by looking for the LOINC codes (if you know where to find them), and traversing what that tells you back to the laboratory equipment.
You might also hear about the positive and negative predictive value (or agreement), abbreviated PPV/PPA and NPV/NPA respectively. This is what the COVID-19 test used on me reports to the FDA. It compares the results from the Aptima test to those of another test (Panther Fusion) made by the same manufacturer (which could introduce another source of error, but according to the manufacturer's testing, that test is perfect).
That's based on the manufacturer's testing results, and doesn't necessarily account for real world implementation. Variations in workflow, quality, et cetera, and assumptions under which the test is performed can have an impact on "accuracy". In the case of COVID-19 laboratory tests, you can find the results of other's evaluations (e.g., one done by Norwell Health Laboratories). For the Aptima test, there's one of those in the second row of the table found at the link. FWIW: That same lab also analyzed the reference test (Hologic Panther Fusion) used in the Hologic report on the Aptima.
As a patient, the first question I have from a test result is "How should this result affect my behavior?"
- For a positive, do I seek treatment, further testing, et cetera.
- For a negative, does that mean I don't have a problem, or should I seek further testing later (and if so, when)?
I won't go into the first issue for positives in detail. I will say that both my wife and I actually decline certain diagnostics because false positive rates are high enough, and the therapeutic value of a true positive result is of limited value at our ages.
There are four different kinds of results that a laboratory test can produce:
True Positive: A positive result when in fact, you actually have a disease
False Positive: A positive result when in fact, you do not actually have the disease.
True Negative: A negative result when in fact, you do not actually have the disease.
False Negative: A negative result when in fact, you actually have the disease.
You can generally find these values in those tables I referenced. For two tables I referenced, the values I have are:
| Result Type | Holigic Aptima Reported | Northwell Health Laboratories |
|---|---|---|
| True Positive | 50 | 71 |
| False Positive | 1 | 0 |
| True Negative | 54 | 75 |
| False Negative | 0 | 4 |
I can use these numbers to compute two other numbers, called the positive likelihood ratio (LR+), and negative likelihood ratio (LR-) using the following formulae:
Sensitivity = TP / (TP + FN)
Specificity = TN / (TN + FP)
LR+ = Sensitivity / (1 - Specificity) = (TP / (TP + FN)) / (FP / (TN + FP))
LR- = (1 - Sensitivity) / Specificity = (FN / (TP + FN)) / (TN / (TN + FP))
| Result Type | Holigic Aptima Reported | Northwell Health Laboratories | Both |
|---|---|---|---|
| Sensitivity | 50 / 50 = 100% | 71 / 75 = 94.7% | 121 / 125 = 96.8% |
| Specificity | 54 / 55 = 98.2% | 75 / 75 = 100% | 129 / 130 = 99.2% |
| LR+ | 100% / 1.8% = 55.6 | 94.7% / 0 = ∞ | 96.8% / 0.8% = 121 |
| LR- | 0% / 98.2% = 0 | 5.3% / 100% = 0.053 | 3.2% / 99.2% = 0.032 |
As you can see, I also combined both evaluations into a composite result.
With the LR- value, I can now estimate the probability that my negative result is correct, but I need ONE more number. That's the pre-test probability I had COVID-19. There are a lot of different ways that I could come up with that number. The most obvious one is to assess it based on the prevalence of disease in my area.
OK, so now let's think about this: Do I consider my country? My state? My county? My town? My region? Where would I even find this data? I might start with my state's dashboard. But that doesn't really say anything about disease prevalence, just a report of increasing cases / 100000 (and that data is out of date for the actual prevalence, b/c COVID has an incubation period of about 5-14 days).
So back searching I go, and I find this paper on estimating prevalence, and it references a few others. Since I live within Massachusetts, but shop in Rhode Island (b/c it has the closest grocery stores), I might want to consider both regions. I can read off results that tell me I need to look at values for prevalence somewhere between 2 and 4%. Because this paper reflects a novel method (e.g., untested), I should go look elsewhere too. An alternative model suggests multiplying the reported case rate by 10. That would give me 14.5% (100158 * 10 / 6.893M) for my state, or about the same for my county.
Now, let's plug those numbers in and math some more using these equations:
Pretest Odds = Pretest Probability / (1 - Pretest Probability)
Post-test Odds = Pretest Odds * LR-
Post-test Probability = Post-test Odds / (1 - Post-test Odds)
| Pretest Probability | Pretest Odds | Post Test Odds | Post Test Probability |
|---|---|---|---|
| 2% | 0.020 | 0.053*0.020 = 0.0010 | 0.1% |
| 4% | 0.042 | 0.053*0.042 = 0.0022 | 0.2% |
| 14.5% | 0.170 | 0.053*0.170 = 0.0091 | 0.9% |
You'll note I didn't bother computing the results based on the Hologic reporting, because according to the manufacturer, it doesn't produce false negatives, and so I'd just get 0% anyway. I also didn't bother computing the results based on both because the Norwell Health Laboratories Reported results give me an upper bound.
What this tells me is, based on whatever prevalence data I believe in (more likely the higher number), I have less than 1 chance in 100 of it being wrong. That's what I wanted to know in the first place.
Without the pretest probability, the lab cannot possibly report the likelihood of the result being incorrect. Other variations in testing might effect this particular labs "accuracy" in reporting on the test, and of course, I don't have any way of knowing that information. But using this math, I could say that even if there performance of the test had twice the false negative rate as the Northwell reported results, the chances that my test result were a false negative were less than 1 chance in 50.
I'm pretty good with that. Applying what else I know (including other influenza-like but not COVID-like symptoms), I can pretty much assume that I'm not COVID-19 positive pretty reliably.
Why spend all of this time figuring out what others might just assume?
There are three reasons:
1. Because it's me, and I want to know. Is there a reason I shouldn't?
2. Because I'm curious.
3. Because I understand that these tests have been released for use without the same level of testing that happens under normal circumstances, because some of the tests (e.g., the Abbott rapid test) have come under fire b/c of their accuracy, and as a result, I want to understand what risks I'm taking not just on behalf of myself, but also my family based on how I behave after getting this result.
Keith
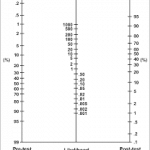
P.S. There's a thing called a nomogram depicted above that can help you do all this math geometrically. All you need to know is pretest probability and likelyhood ratio, that a ruler will compute the post-test probability for you. I had one somewhere (it came with one of my Informatic's text books), you can print one out. But first you needed to know how to get the key value, the likelihood ratio. Using that, and the likelihood ratio for a positive result (55-121), if that had been my result, my post-test probability would be somewhere between 70 and 100%.

0 comments:
Post a Comment