 |
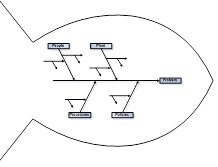
| Fishbone Diagram |
EEIs, or measures of situation awareness work the same way as quality control measures work on a process. You follow the process, and measure those items that are critical to quality. Finding the things that are critical to quality means looking at the various possible failure modes, and root causes behind those failures.
Let's follow the pathway, shall we, for COVID-19:
We look at the disease process in a single patient, and I'll start with a complaint, rather than earlier. Patient complains of X (e.g., fever, dry cough, inability to smell/taste, et cetera). From there, they are seen by a provider who collects subjective data (symptoms), objective data (findings), performs diagnostics, and makes recommendations for treatment (e.g., quarantining, rest, medication) or higher levels of care (admission to a hospital or ICU), more treatment (e.g., intubation), changing treatment (e.g., extubation), changing levels of care (discharge), and follow up (rehabilitation), monitoring long term changes in health (e.g., after effects, chronic conditions).
That's not the only pathway, there are others of interest. There may be preventative medications or treatments (e.g., immunization).
In each of these cases, there are potential reasons why the course of action cannot be execute (a failure). Root cause analysis can trace this back (ICU beds not available, medication not available, diagnostic testing not available or delayed).
As new quality issues arise, each one gets its own root-cause-analysis, and new measures can be developed to identify onset, risk of those causes.
We (software engineers*, in fact engineers in general) do this all the time in critical software systems, and often, it's just a thought experiment, we don't need to see the event to predict that it might occur, and prepare for its eventuality.
Almost all of what has happened with COVID-19 with respect to situation awareness has either been readily predicable, OR has had a very early signal (a quality issue) that needed further analysis. If one Canary dies in the coal mine, you don't wait for the second to start figuring out what to do. The same should be true as we see quality issues arise during pandemic.
Let's talk about some of the reasons behind some of the Use Cases SANER proposed for measures, and why:
SANER started in the last week of March, by April 4 we had already understood the need for these measures:
- PPE ... before there was a measure for PPE, there was a CDC spreadsheet to determine utilization of PPE, there were media report about mask availability, people couldn't buy disinfectants.
- What happens when providers get sick? Or provider demand exceeds local supply?
- Hearing about limited testing supplies in NYC (sample kits, not tests).
- Stratification by age and gender: Many state dashboards were already showing this.
and by April 10, - Ethnic populations are getting harder hit we hear from a provider in Boston. Social determinants need to be tracked.
in June we added one more that we knew about but hadn't written down yet - Non-acute settings (e.g., Rehabilitation and long term care) need attention. We actually knew this back in late February.
In the Future we can already tell that: - There will be more diagnostic tests to account for.
- As we learn about treatments (e.g., Medications), we'll need measures on use and supplies
- As immunizations become available, again we'll need measures on use and supplies, but also measures on ambulatory provider capacity to deliver same.
- Do you have a process to reuse usually disposable materials (e.g., masks)?
- What is the rate of growth in cases/consumption/other quantifiable thing presently being experienced by your institution. Different stages of the pandemic have different growth characteristics, e.g., exponential, linear, steady state at different times and regions.
* And if you aren't doing this in your software on a routine basis, you are programming, not engineering.

0 comments:
Post a Comment